To get a detailed, visual replay of your test execution and understand exactly what happened during each step,
Stably provides comprehensive analysis tools for understanding and improving your test suite’s performance.
- Playwright Trace: View the standard Playwright trace viewer
- Stably Trace: Access Stably’s enhanced execution viewer
- Auto-heal Changes: Compare original vs. AI-modified tests
- Heatmap: View flakiness patterns across test runs
- Test History: View historical test run data
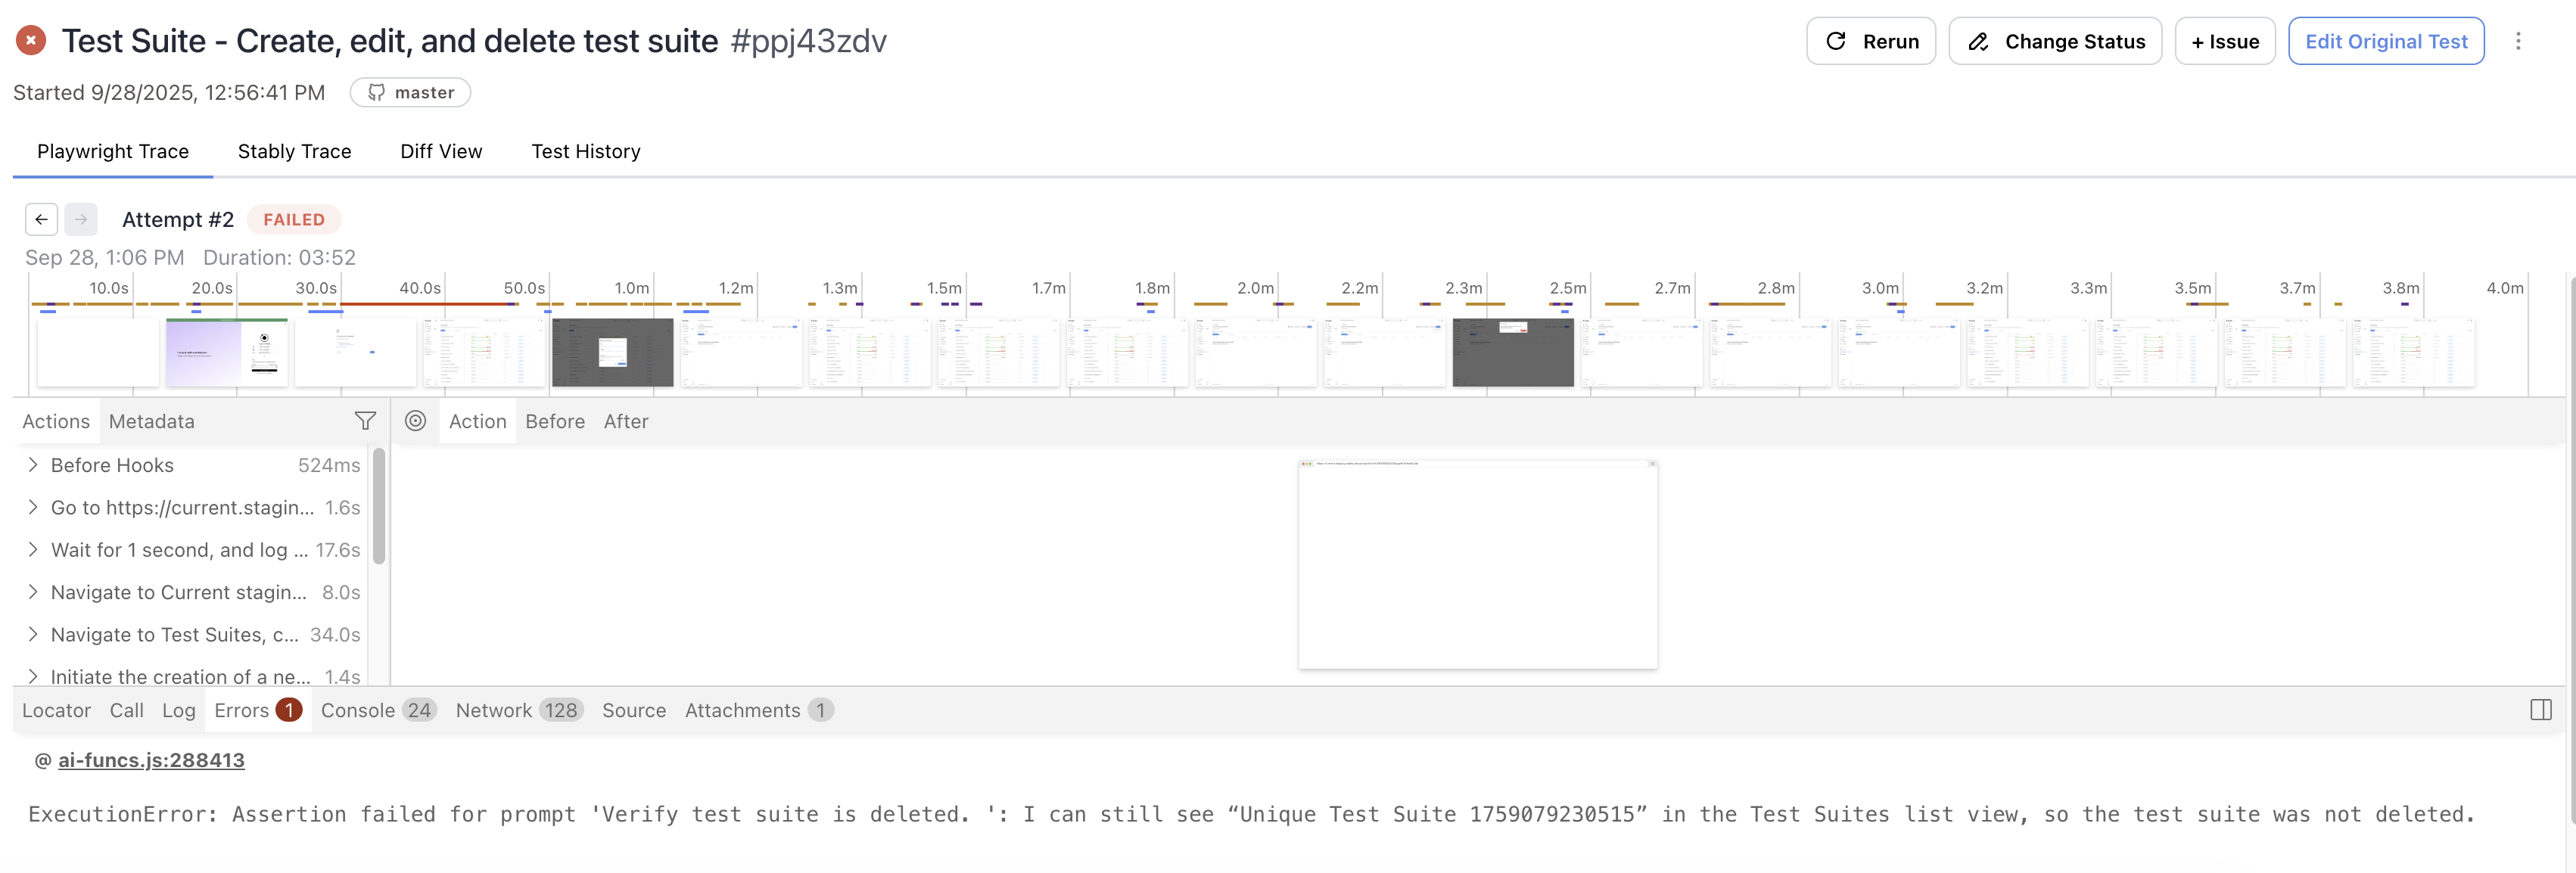
Playwright Trace Viewer
The Playwright Trace Viewer provides standard debugging capabilities with step-by-step action replay, screenshot comparisons, timeline visualization, and network activity monitoring. It offers comprehensive console logs and error highlighting to help identify test failures quickly.
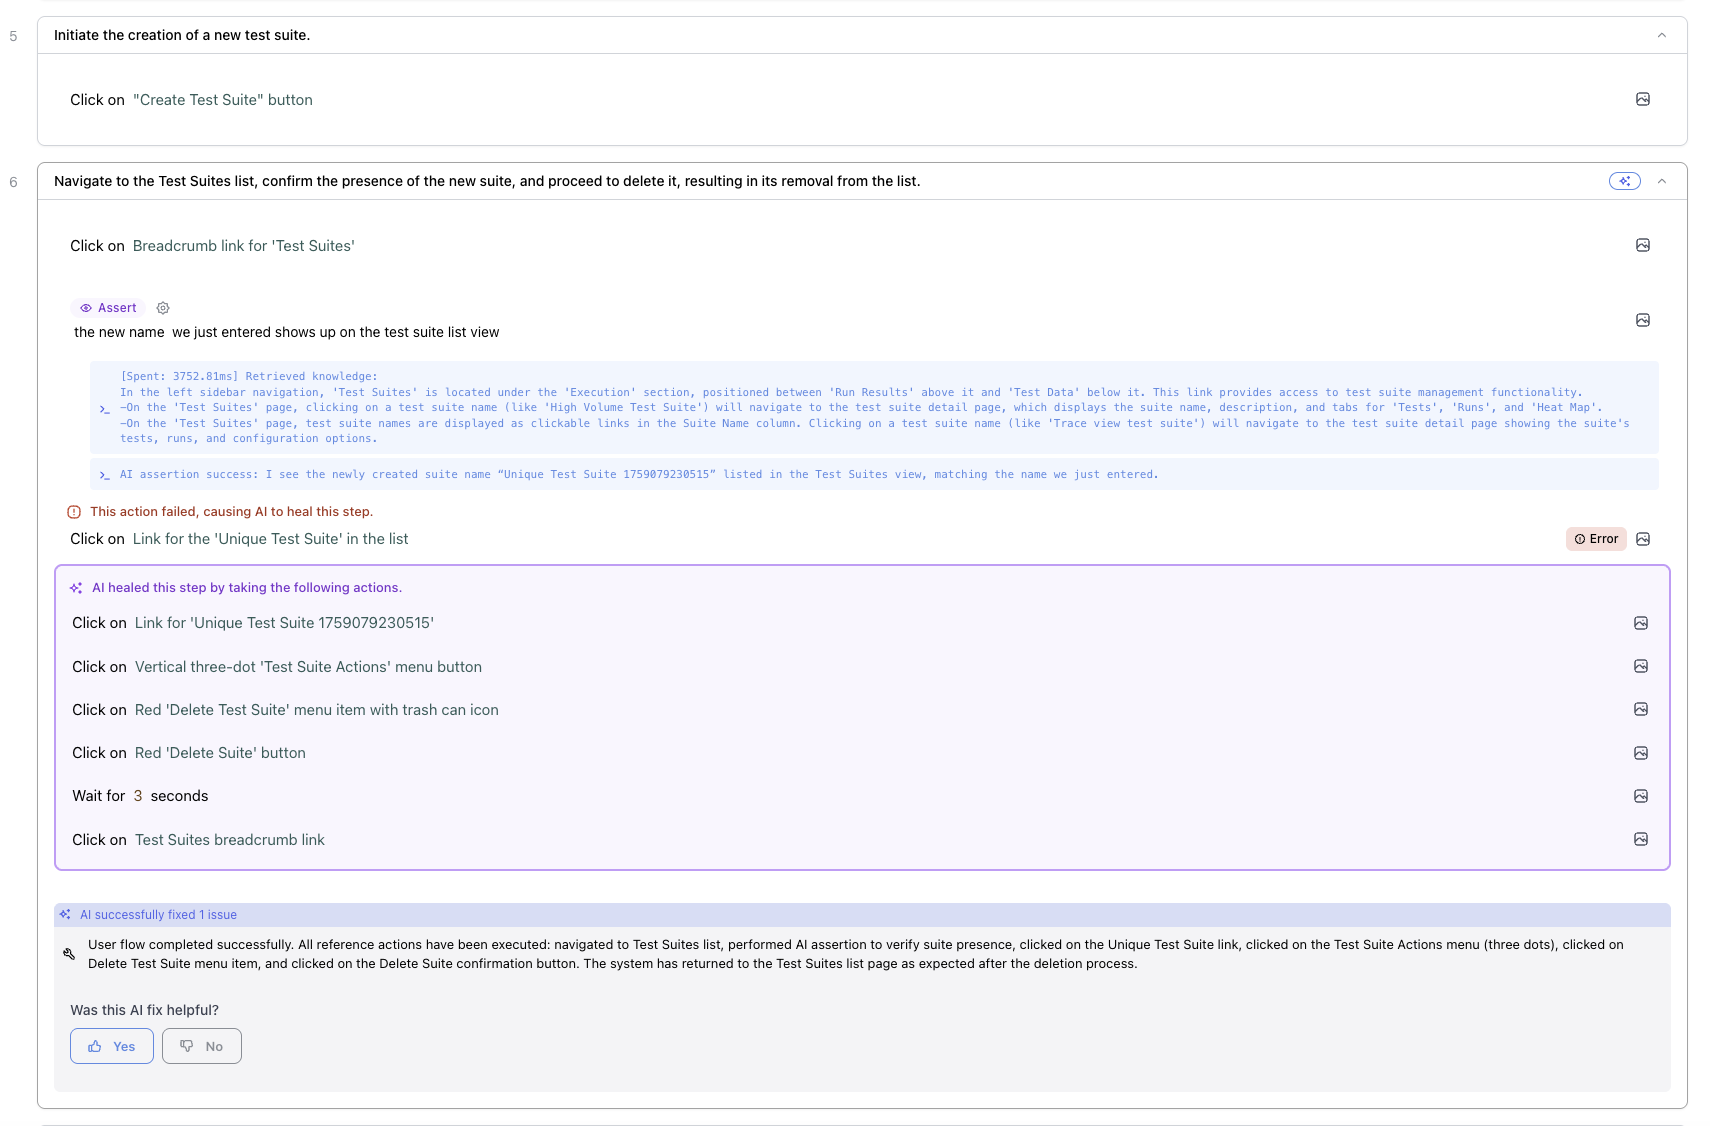
Stably Trace Viewer
The Stably Trace Viewer enhances the debugging experience with AI-powered insights, advanced error analysis, conditional logic visualization, and historical comparison features. It tracks healing attempts and provides action-level details for deeper test execution understanding.
Traces are stored securely in cloud storage and are accessible through the platform’s trace viewer interface.
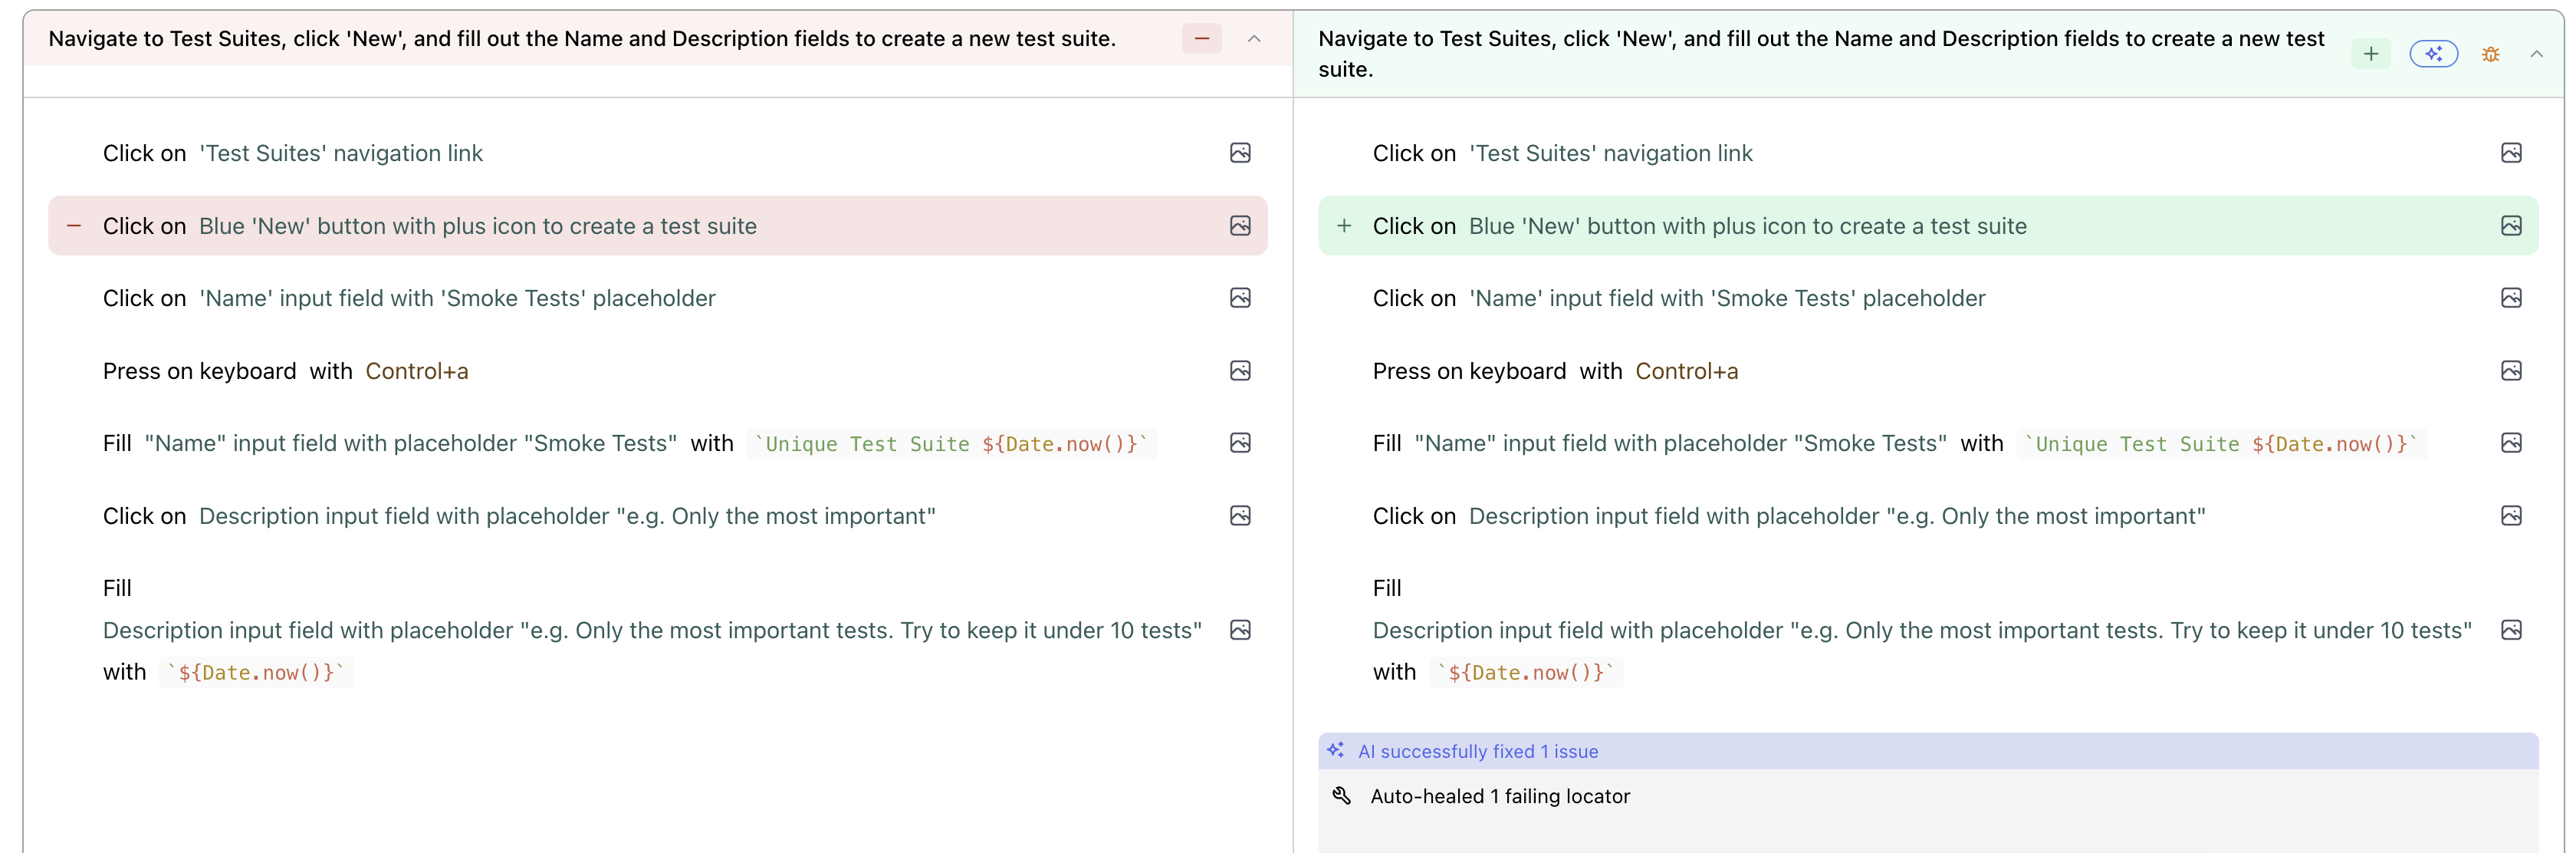
Diff View
The Diff View provides a powerful interface for reviewing and managing AI-suggested test modifications through intelligent auto-healing.
Auto-Healing with Diff View
The Diff View displays AI-suggested test modifications when auto-healing detects outdated tests. For detailed information about how auto-healing works, see AI Auto-heal.
Diffview Benefits:
- Side-by-side comparison of original vs. AI-modified test steps
- Visual screenshot comparisons to validate changes
- Accept or edit options - apply changes immediately or use the no-code editor for further refinement
- Version control - accepted changes become the new baseline for future test runs
You can configure auto-healing sensitivity levels in AI Agents to control how aggressively the system suggests modifications to your tests.
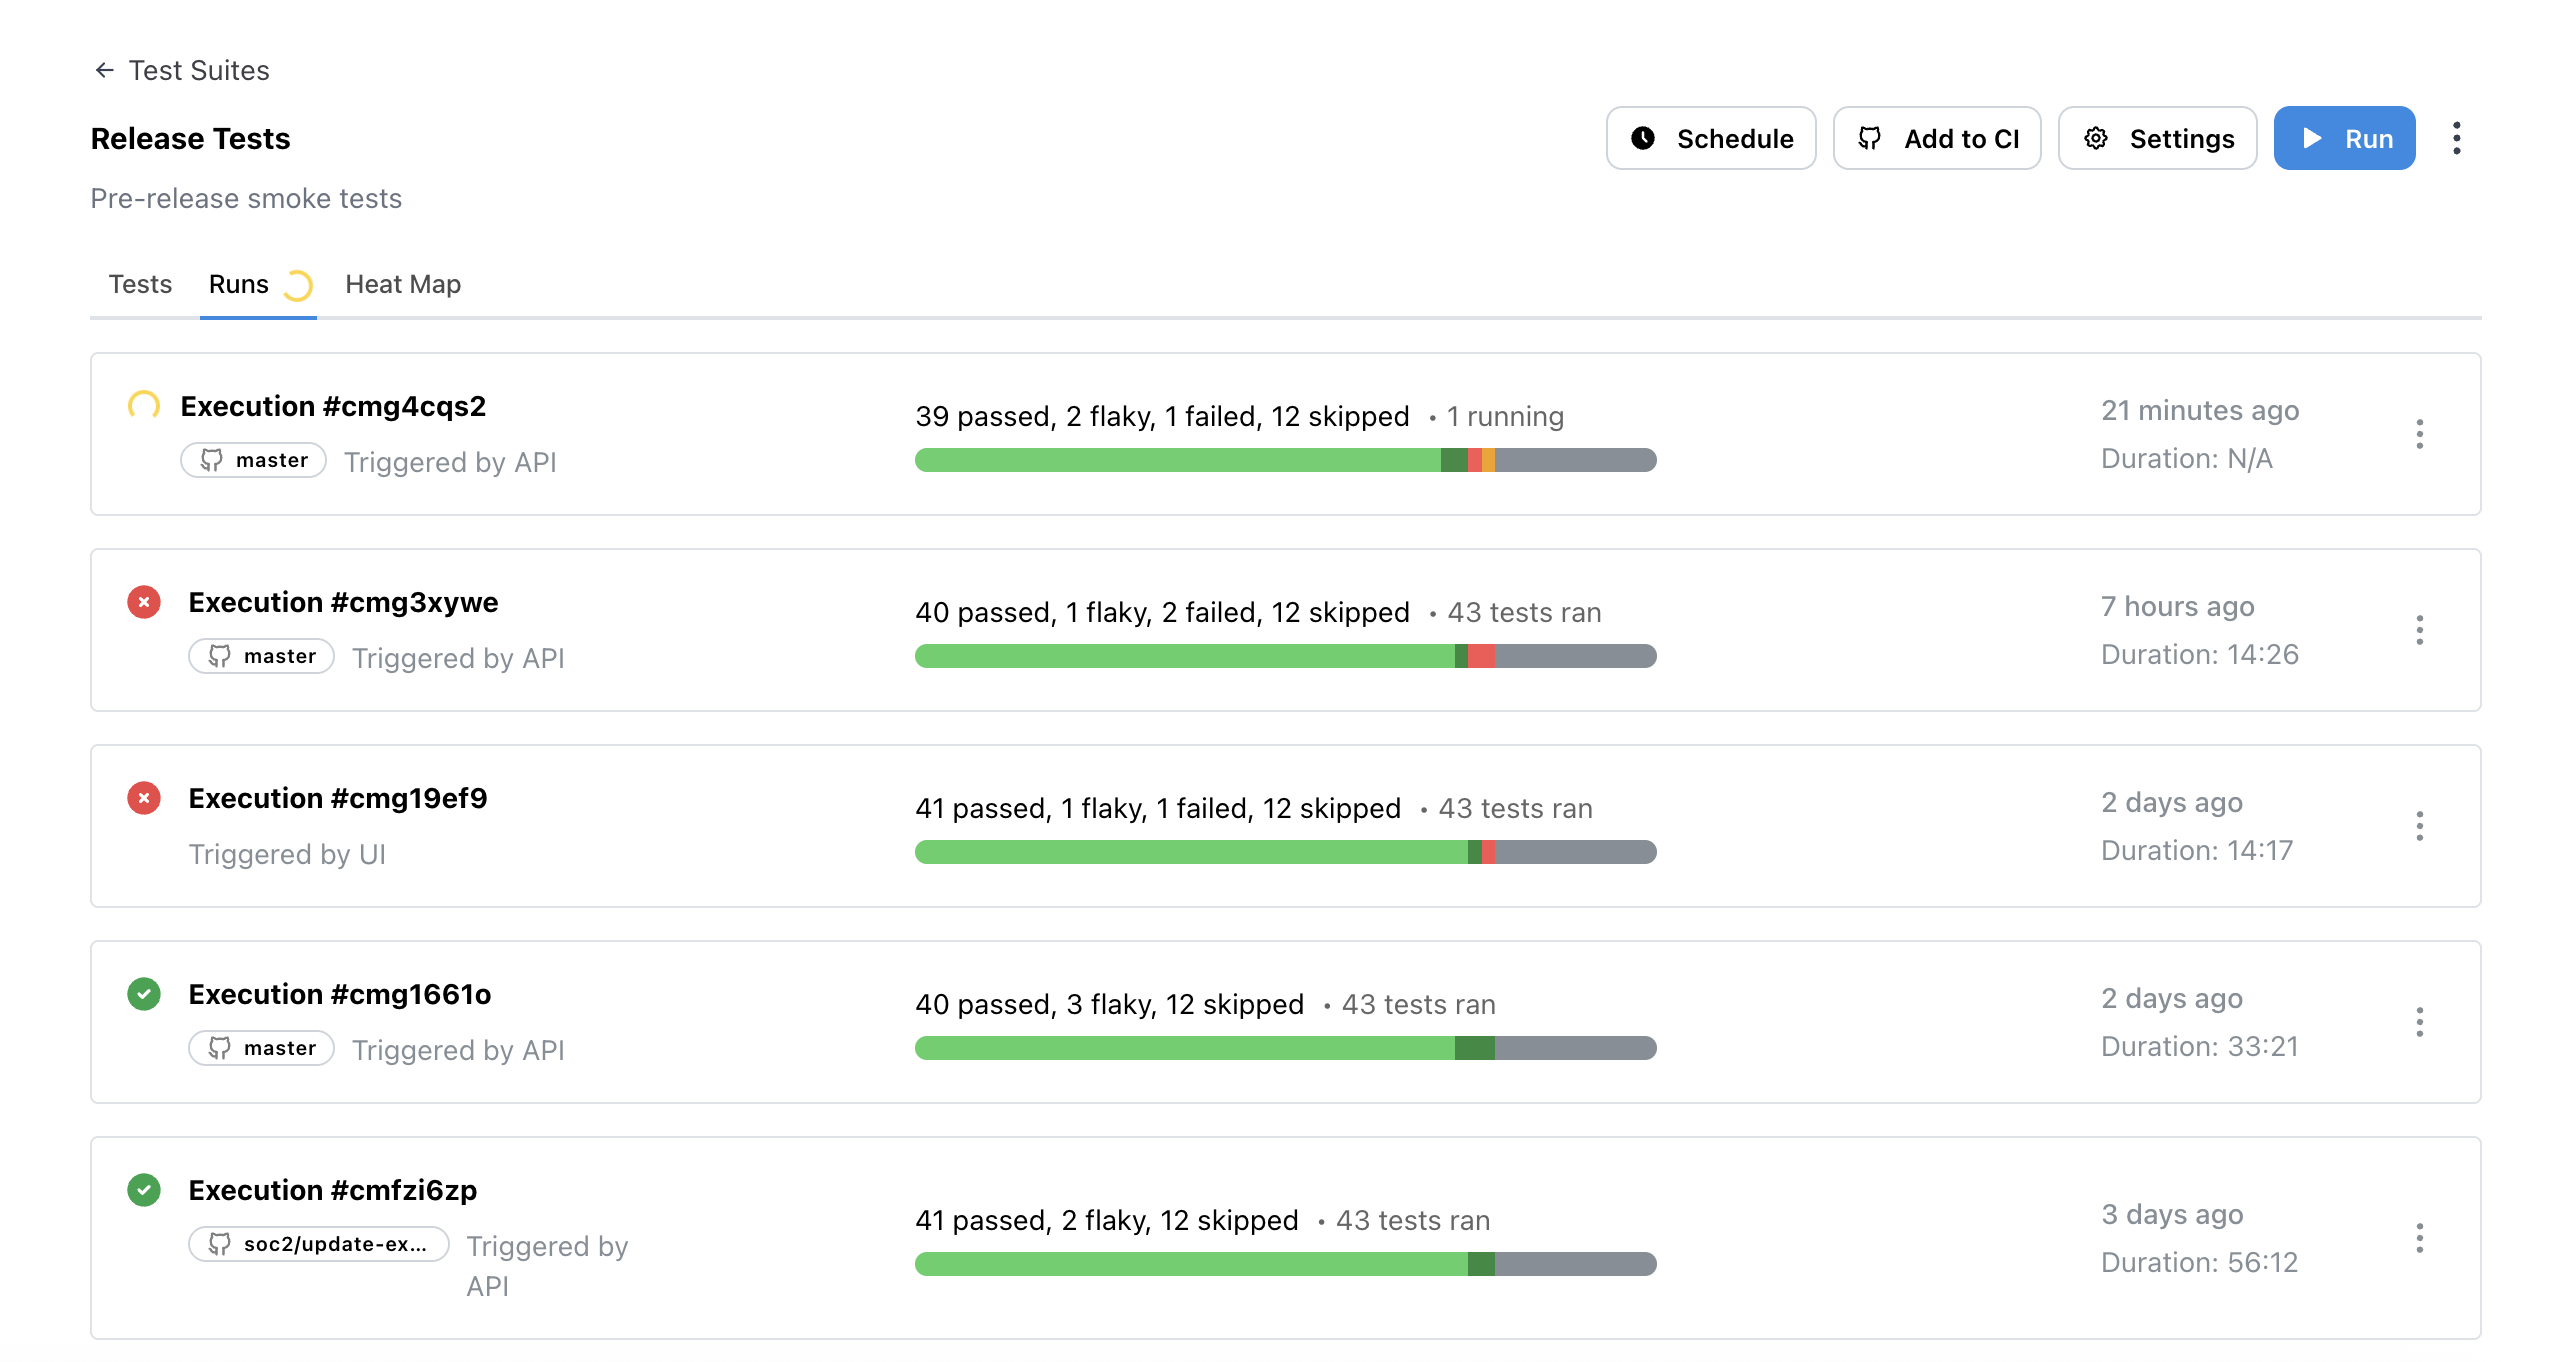
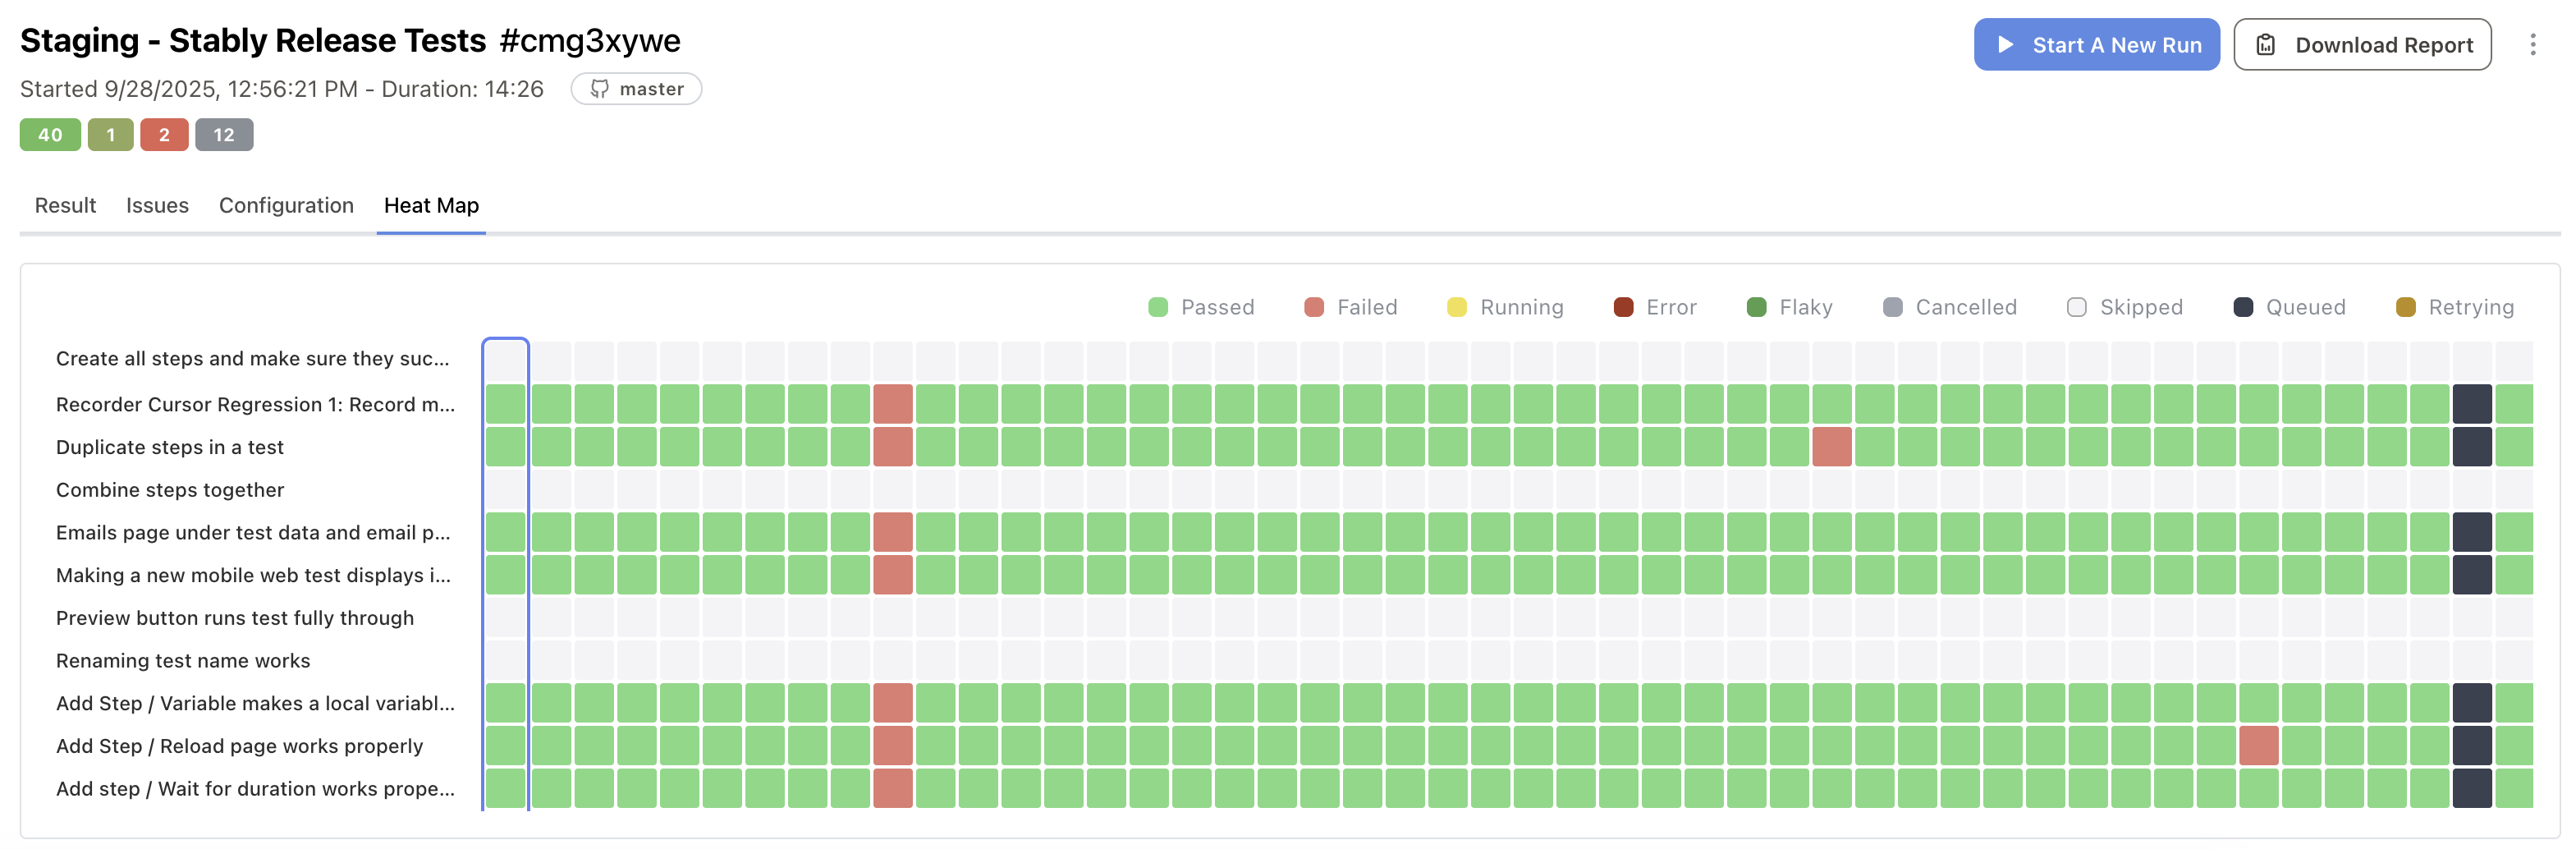
Heatmap View
The heatmap visualization provides a color-coded grid to quickly identify flaky and unreliable tests across your test suite.
Understanding Heatmap Colors
- 🟢 Green: Passed tests
- 🟢 Dark Green: Flaky tests (passed after retries)
- 🔴 Red: Failed or error tests
- 🟡 Yellow: Running or retrying tests
- ⚪ Gray: Skipped or cancelled tests
Identifying Flaky Tests
Use the heatmap to spot reliability issues by identifying tests that consistently fail or show intermittent issues. You can spot tests becoming less reliable over time and get a comprehensive view of your entire test suite’s stability.
Interactive features help you analyze patterns: filter by status by clicking legend items to focus on specific test outcomes, hover for detailed information including duration and timestamps, click any cell to navigate to the specific test run, and analyze timeline patterns across recent runs.
When flaky tests are identified, prioritize fixes by improving element selectors to be more robust, adding appropriate waits for dynamic content, ensuring consistent test environments, and breaking down complex tests into smaller, focused ones.
Export Reports
Export comprehensive test reports in HTML format by navigating to your test suite run results page and clicking the export button to generate a downloadable HTML report.
The exported report includes project and suite information, individual test results with status icons, detailed test steps and descriptions, execution duration metrics, and browser and environment details.